Changing to CDC Risk Levels
You are now switching to a different risk level set. These new levels, the CDC Transmission Indicators, use the same metrics as the MI Start Map Levels (% positive tests and case rates) but calculates them differently.
Risk Level Calculation
MIStartMap Risk Levels
Uses the worse indicator of:
- the 7-day average number of new cases per million population per day, OR
- the 7-day average percent positivity
Risk Level Calculation
CDC Risk Levels
Uses the worse indicator of:
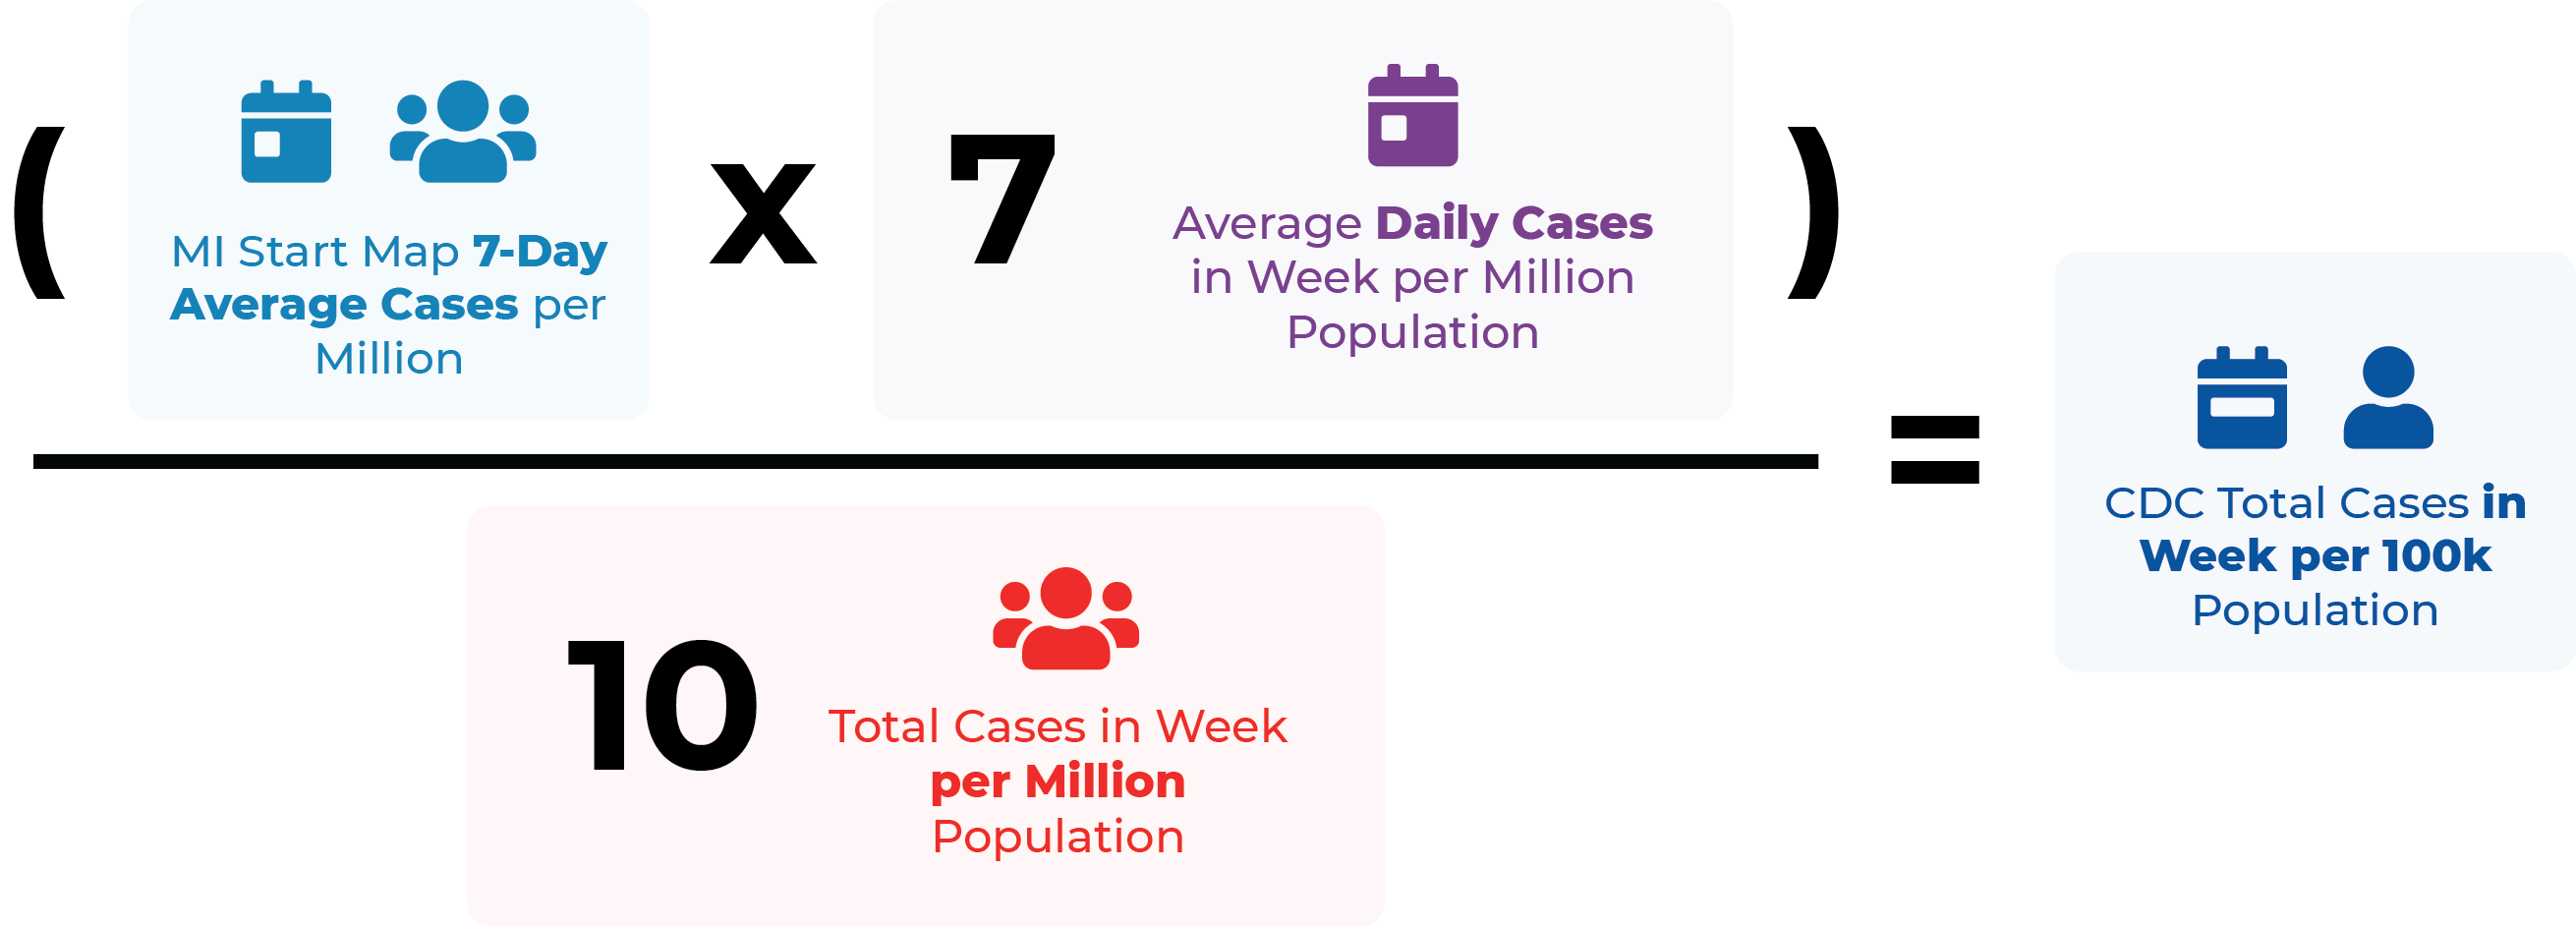
- the total number of new cases per 100,000 population over the previous 7 days, OR
- the 7-day average percent positivity
We use our MI Start Map numbers and translate them to match the CDC's metrics. The policy recommendations from MI Start Map align with the CDC's overall dashboard and our data remains accurate. Here's an example of how we translate numbers for the Cases metric: